Investigating Fairness in a Decarbonised European Economy
A model of how Europe could reach net zero by 2050 if every country has to gain from taking part, rather than simply being told what to build.
About 100 GW more renewable capacity and 180 GW of interconnection than the cheapest plan
Individual thesis. Built the model, the data set and the analysis on my own.
- 21
- countries modelled to 2050
- 2,500 GW
- EU capacity in the fair plan
- 180 GW
- cross border cables, vs 135 GW
- MINLP → MILP
- reformulation that made it solvable
Overview
Net zero plans for Europe are usually worked out as if one person were in charge of the whole continent and one budget paid for everything. That gives the cheapest answer on paper, and it quietly assumes every country accepts whatever job the plan hands it. In real life several would not.
So I asked a different question. If a country only joins in when doing so leaves it better off than going it alone, what does the 2050 power system actually look like?
What I did
- Built the whole model in GAMS from scratch, covering 21 countries from 2018 to 2050 across nuclear, gas, gas with carbon capture, biomass, wind, solar, hydro and batteries.
- Solved a national baseline first, where each country minimises its own cost under its own net zero constraint, giving the benchmark any deal has to beat.
- Shared the gains from cooperating with Nash bargaining, which multiplies each country's gain together and starts life as a MINLP too large to solve.
- Reformulated that into a MILP by taking logs and approximating the curve with SOS2 breakpoints, which is what made a commercial solver finish it.
- Compared three futures on identical data: every country alone, one central planner, and the bargained deal.
Methods
- Two stage optimisation: national baseline, then cooperative bargaining
- Nash objective linearised with logs and SOS2 breakpoints, MINLP to MILP
- Multi region capacity expansion in GAMS, solved with CPLEX and Gurobi
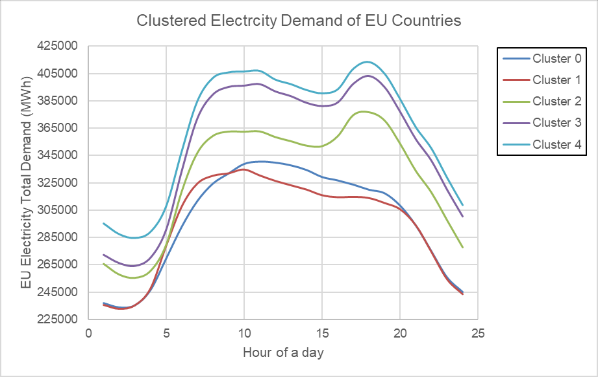
- 8,760 hourly demand points clustered into five representative days
- Ramp rates, storage state of charge, build limits and tightening emissions caps
Key results
- 01
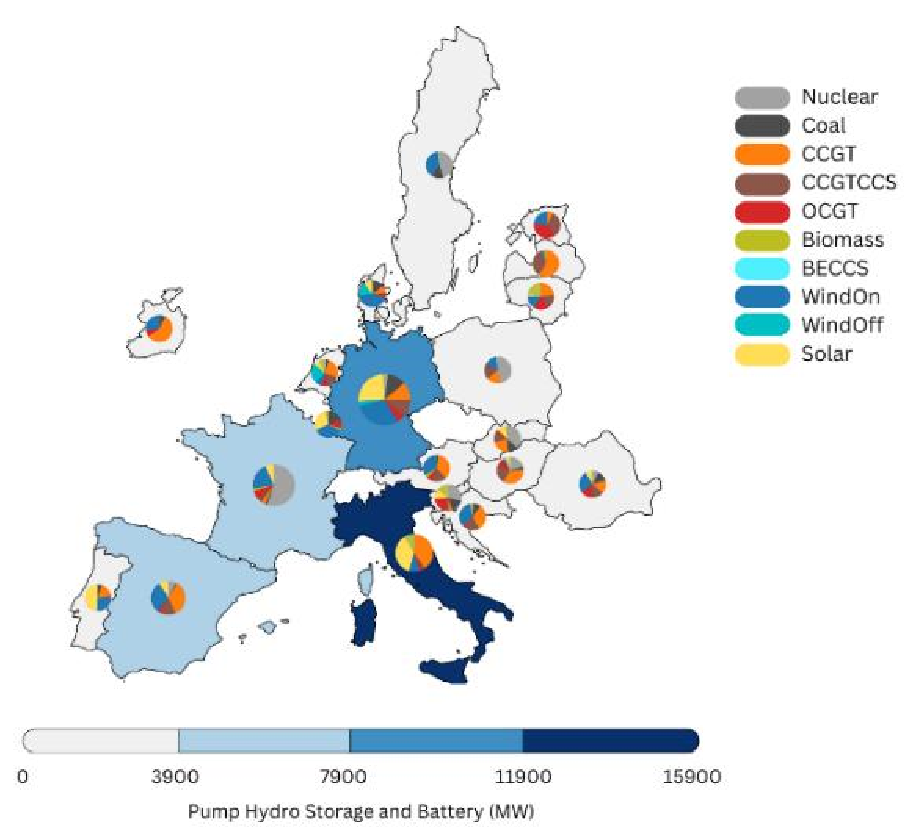
Fairness means building more, not less. The fair plan puts up roughly 100 GW more wind and solar than the centralised one, concentrated in Germany, France, Spain and Italy.
- 02
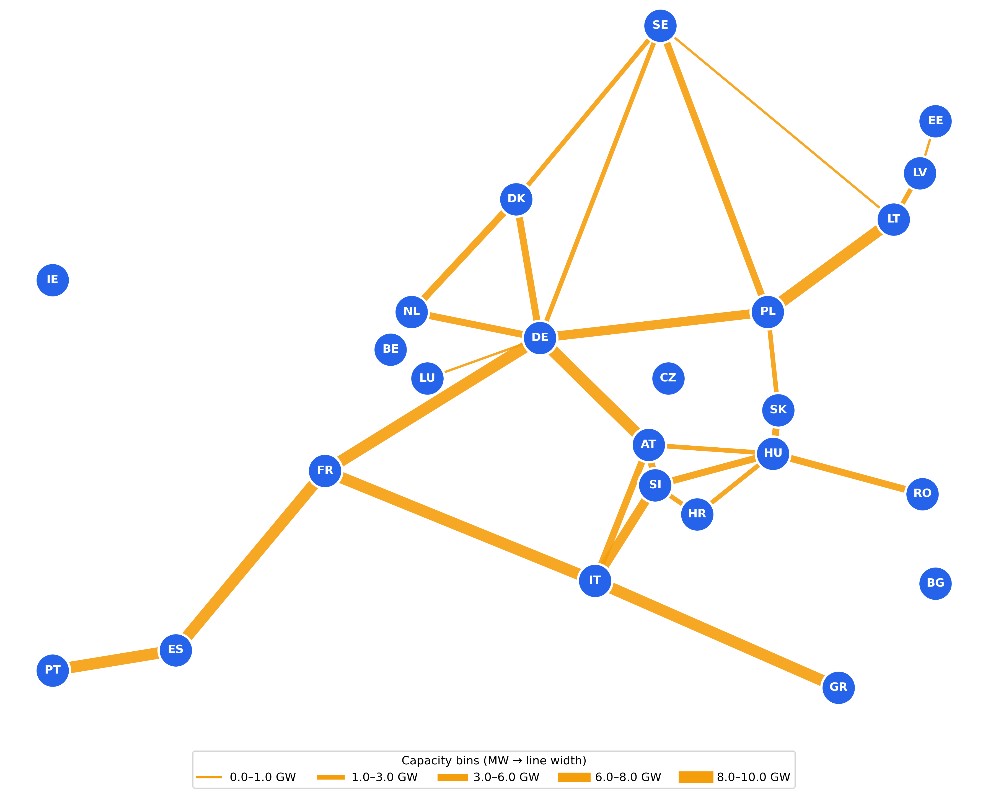
The grid has to grow before anyone will trust it. Cross border capacity reaches about 180 GW in the fair plan against 135 GW under a central planner, because countries only rely on imports when the connection is strong.
- 03
The results line up with an independent forecast. The technology split lands close to the TYNDP Global Ambition scenario, a useful sanity check that the model is not drifting.
- 04
Cooperation is what keeps Europe inside its carbon budget. Both cooperative futures stay within it. Left alone, several countries take a slower and more expensive route to net zero.
Outcome
This turns an argument people usually have in words into numbers. It shows what a politically realistic transition costs against the cheapest one, and where the extra money goes: more wind and solar in the big economies, and a far stronger grid tying everyone together.